
UV-VIS Analysis
UV-VIS Analysis Services
This is the official page for UV-VIS Sample Analysis. In which InstaNANO provides UV-VIS analysis services to all the users Globally, which includes
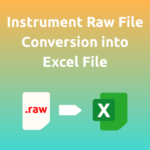
Instrument Raw Data File Conversion to Excel File
Have FTIR, XRD, NMR, or UV-Vis instrument files that your software cannot read or export? Upload them to InstaNANO and we will convert them into clean, ready-to-use Excel files. Our expert team handles your data securely and ensures accurate conversion so you can easily plot, analyze, compare, and include the results in your research. Upload your file and receive a perfectly formatted Excel output compatible with major analysis and plotting tools.
File Upload Guidelines
- Accepted Instruments: FTIR, XRD, NMR, UV-Vis.
- Upload Note: Some common instrument file formats are restricted for security reasons. If your file will not upload, compress it to ZIP format (.ZIP) and then upload.
- NMR Supported Files: Zip Files (.ZIP), Agilent / Bruker Ion Trap (.YEP), Agilent ChemStation (.MS, .CH), Bruker Aspect 2000/3000, Briker MS Data, Bruker TopSpin/UXNMR/XWIN-NMR, Bruker WIN-NMR (.FID, .SER, .1R, .RR), Bruker XMass, CS ChemDraw (.CDX, .CDXML), Chemical Markup Language (.CML), ElViS OPUS (.0), ElViS Omnic SPA / Galactic GRAMS SPC (.SPA, .SPG, .SPC), GE/Nicolet, JEOL Lambda (.NMFID, .NMDATA, .NMF, .NMD), JEOL MSQ1000 (.SPE), JEOL msAxel (.RBS, .RBC, .RPS, .RPC), MS CSV File (.CSV, .TXT), Magritek Prospa (.1D, .2D), MestReC (.MRC), MestReNova (.MNOVA .MNPAG, .MNCS, .MNPL, .XML), Molfile (.MOL), NMRPipe (.FID, .FT1, .FT2), NetCDF ANDI-MS (.CDF), Nuts Type 1/2/3, Old Gemini, Oxford Instruments RINMR (.RiDat), PCA Model (.MPCA), Publications Submitted Data (.MNPUB), QOne, QOneTec (.NMR), SDfile (.SDF), SIMPSON (.FID, .SPE), Siemens MagnetomV Vision (.RAW), StereoSitter Projects (.JSON), SwaN-MR, Techmag (.TNT), ThermoScientific Xcalibur (.RAW), Varian Gemini/VXR from VHelper, Varian VNMR, Varian/Chemagnetics Spinsight, Waters MassLynx (.DAT, .IDX, .INF, .RPT), PerkinElmer block structure file (.SP), mzXML/mzData (.mzXML, .mzData, XMLl).
- XRD Supported Files: PANalytical XRD Measurement (.XRDML, .RD, .SD, .FP, .DI, .UDF, .UDI, .LIS), BRUKER (.RAW, .LST, .UXD), STOE (.PRO, .DAT), SEIFERT (.ASC), SKROWONEK UDS2 (.UDS), LH-Rietveld (.LHP), DBW-Rietveld (.RFL), Crystallographic Information (.CIF), JCAMP (.JDX, .JCP), ICDD (.PD3), MDI JADE (.MDI), ICSD Database (.CRY).
- FTIR Supported Files: Spectra / Groups (.SPA, .SPG), JCAMP-DX (.JDX), PCIR (.IRD, .IFG), Nicole SX/DX (.NIC, .SPC), CSV Text (.CSV), Peak Solve (.0), GRAMS (.SPC, .GLD), Perkin-Elmer (.SP), Spectacle (.IRS, .SDA, .UVD), GAML (.GAML), BRUKER (.[0-9]), Jasco (.JWS), Mattson (.IGM, .ABS, .DRT, .SBM, .RAS, .TRN).
- UV-Vis Supported Files: Spectrum (.SPC), Photometric Files (.PHO), Kinetics (.KIN), Report (.rpt).
What You Will Get
- Converted Excel File: A cleaned, well-formatted Excel (.xlsx) file converted from your instrument raw data for direct use in analysis and plotting.
- Compatibility: Files usable with Excel, Word, PowerPoint, Origin, and other analysis/plotting tools.
- Ready-to-Use Data: Properly extracted and organized columns for easy plotting, matching, and analysis.
- Lifetime Access: Converted files are saved in your InstaNANO account for indefinite access.
- Secure Delivery: Confidential handling and secure file transfer back to you.
Why Choose InstaNANO
- Accurate & Professional Conversions: Files are processed by experts to ensure precise extraction and proper formatting of spectral and instrument data with no missing points or unreadable tables.
- Trusted by Researchers Worldwide: InstaNANO’s analytical services are used in universities, research centers, and industries; our results have been cited in publications. See how our work is cited: https://instanano.com/citations/
- Secure & Confidential Uploads: Only accepted file types are allowed and all conversions are handled with strict confidentiality.
- Fast Turnaround: Receive your converted Excel file within 1-2 working days after placing the order.
- Hassle-Free Online Experience: Upload → Relax → Download your converted file.
NOTE: Please browse our collection of online analysis services: https://instanano.com/analysis-services-online/
Custom Analysis
Please contact us before placing this order so we can understand your custom analysis needs. The current price is for reference only; the final price will vary depending on your requirements. Analysis will be performed as agreed in discussions with our team.
File Upload Guidelines
- Contact us prior to ordering to define the scope, objectives, and any special requirements for your analysis.
- Provide a clear description of the sample, measurement conditions, and the specific analyses you require.
- Upload raw data files or indicate if you will ship physical samples; include sample identifiers and relevant metadata with your files.
- If you are unsure about file types or formats, mention your instrument or software and our team will advise on the best way to share data.
What You Will Get
- Expert Interpretation: Research-grade analysis and interpretation performed by qualified scientists with domain expertise.
- Publication-Ready Files: Clean, structured results suitable for inclusion in manuscripts, presentations, and reports.
- Flexible Output Formats: Data delivered in formats compatible with major scientific software for further analysis or visualization.
- Fast Turnaround: Timely delivery to help you meet research deadlines and project milestones.
- Secure & Confidential Handling: Your files and results are protected and treated with strict confidentiality.
- Lifetime Access: Results remain available in your InstaNANO account for re-download at any time.
Why Choose InstaNANO
- Trusted by Researchers Worldwide: Used by students, researchers, laboratories, and industries; our results are cited in research papers, theses, books, patents, and industrial reports. See citations: https://instanano.com/citations/
- Expert Team With Scientific Experience: Analyses are performed by professionals with strong backgrounds in materials science, spectroscopy, crystallography, nanotechnology, and chemical characterization.
- Fast, Reliable, and High-Quality Services: Services such as FTIR, XRD, Raman, and SEM are delivered with high precision to support your research needs.
- Publication-Ready Outputs: Files compatible with Excel, Word, PowerPoint, Origin, MATLAB, Python, and other major scientific software.
- Secure & Confidential Data Handling: Uploaded files and results are protected and never shared with third parties.
- Lifetime Storage of Results: All results remain permanently accessible in your InstaNANO account.
- Hassle-Free, Fully Online Process: Upload data or ship samples and let our experts handle the rest without the need for specialized software or instruments.
- Wide Range of Analytical Services: From FTIR and XRD to Raman, SEM, UV-Vis, and advanced data analysis, InstaNANO offers a comprehensive suite of services. Explore services: https://instanano.com/analysis-services-online/
NOTE: For related services and more information, visit our analysis services page: https://instanano.com/analysis-services-online/ and our citations page: https://instanano.com/citations/
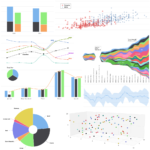
Scientific Graph Plotting for Publication
Presenting your scientific results clearly is as important as the experiments themselves. Whether your data comes from spectroscopy, microscopy, material characterization, or any analytical technique, InstaNANO transforms raw values into professional, publication-quality graphs. If you are unsure how to plot your results, which graph style is best, or how to format figures for journals, our expert team will create visually appealing, scientifically accurate, and journal-compliant graphs for you.
File Upload Guidelines
- Include raw numerical data with clear column headers and units.
- Preferred data formats: CSV, XLSX, or plain text files; compress multiple files into a ZIP if needed.
- Provide any reference figures or style examples as PNG, TIFF, or PDF to indicate preferred layout or colors.
- Specify desired figure size, aspect ratio, and any journal-specific requirements when placing the order.
- For fitted or processed data, include fitting parameters, peak assignments, and any relevant analysis notes.
What You Will Get
- Publication-Quality Graphs: High-resolution, professionally formatted figures suitable for international journals, conferences, and books.
- Journal Compliance: Figures that meet publication guidelines of major publishers (Elsevier, Springer, ACS, Wiley, Nature, Taylor & Francis, etc.).
- Scientific Standards: Clear axis labels, legends, proper scales, annotations, and consistent color schemes following best practices.
- Resolution: Output prepared at proper resolution (300–600 DPI) for print and digital publication.
- Editable Source Files: Editable/source files provided on request so you can adapt figures later.
- Multiple Output Options: Raster and vector outputs provided as required for publication and presentation.
Why Choose InstaNANO
- Expert Scientific Plotting: Graphs are created by researchers experienced in spectroscopy, microscopy, nanotechnology, materials science, and data visualization—ensuring accuracy and clarity.
- Publication-Ready Output: Figures follow international journal standards with correct formatting, clear labels, and clean visual design preferred by reviewers and editors.
- Trusted by Researchers Worldwide: Used by students, researchers, laboratories, and industries globally; our results appear in research papers, theses, books, patents, and reports. See citations: https://instanano.com/citations/
- Software Compatibility: Outputs compatible with Excel, PowerPoint, Origin, Python, MATLAB, Illustrator, GraphPad, Canva, and other common tools.
- Fast Turnaround: Quick delivery to help you meet paper deadlines and thesis submission timelines.
- Hassle-Free Online Process: Upload your data, specify requirements, and receive perfectly plotted graphs without worrying about formatting.
- Lifetime Storage: All plotted figures remain available in your InstaNANO account for future downloads.
NOTE: Please browse our collection of other online analysis services: https://instanano.com/analysis-services-online/
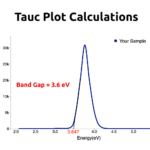
Band gap Calculation from Tauc Plot
If you have synthesized your sample but are having problems with analysis, we will calculate the band gap from the Tauc plot for your sample while you relax at home.
File Upload Guidelines
- Provide optical data as wavelength (nm) or photon energy (eV) with corresponding absorbance, reflectance, or absorption coefficient in CSV or TXT format.
- Indicate whether the material is expected to have a direct or indirect electronic transition.
- Include sample name, measurement units, measurement conditions (e.g., temperature, substrate), and any baseline corrections applied.
- Mention any publication requirements or preferred figure dimensions when uploading files.
What You Will Get
- Band gap value: Band gap value in eV.
- Tauc plot image: Tauc plot image suitable for direct use in international publications.
Why Choose InstaNANO
- Experienced in optical band gap analysis and Tauc plotting.
- Publication-quality figures and clear, concise reporting.
- Confidential handling of your data and timely delivery.
- Support for follow-up questions and minor revisions.
NOTE: You may also be interested in our Optical Characterization and XRD Analysis services.